Hyper-accelerating store credit
How to cut the red tape out of credit and win space at checkout.
Grupo Casas Bahia · Product Designer Specialist
Signing up for the Digital Installment Card was a red-tape marathon, and customers gave up along the way. The goal: speed up store credit and grow its share of the payment mix. I brought research and funnel data to the table, redesigned the journey and aligned product, tech and business around one decision.
+117% in payment share
What I did
- Research and discovery
- Data analysis and tagging
- Prototypes and usability tests
- Growth and A/B tests
- Credit checkout redesign
- Partnership with the triad and the business
- Company
- Grupo Casas Bahia · Digital Installment Card (CDC)
- Role
- Product Designer Specialist
- Period
- 2022 onwards
- Team
- Product, design and engineering triad, with the business at the table
- 157 screens mapped, one by one, before designing anything
- 96 opportunities, prioritized with the triad and the business
- 100% of deliveries A/B tested: only what worked stayed
The Digital Installment Card (Carnê Digital) is Casas Bahia's own credit: customers pay in installments without using their card limit. When I inherited the digital journey, it had no documentation, no context and no owner. It had a queue of technical tickets.
A product, not a project
The Carnê sits at the center of the group's CDC First strategy, and my part was the self-service purchase: customers signing up on their own, at the website and app checkout. The business wanted more share and had little budget. Engineering could not involve other teams. And I wanted a journey our audience could finish without effort.
With so little room, the question that guided everything was not "how do we redesign it". It was "how do we avoid spending the little we have on something that is not worth it". We agreed on three rules with the triad: small deliveries from day one, every screen in an A/B test (if it did not deliver, it went back to the drawing board) and a product born tagged, with before and after data.
Where customers gave up
Before designing, I walked through all 157 screens of the journey, on web and app, and checked the tagging on each one. The event map and data collection became mine, and the funnel pointed the way: the payment screen lost two thirds of the people who reached it, and the sign-up form dropped a quarter before customers even saw the installments.
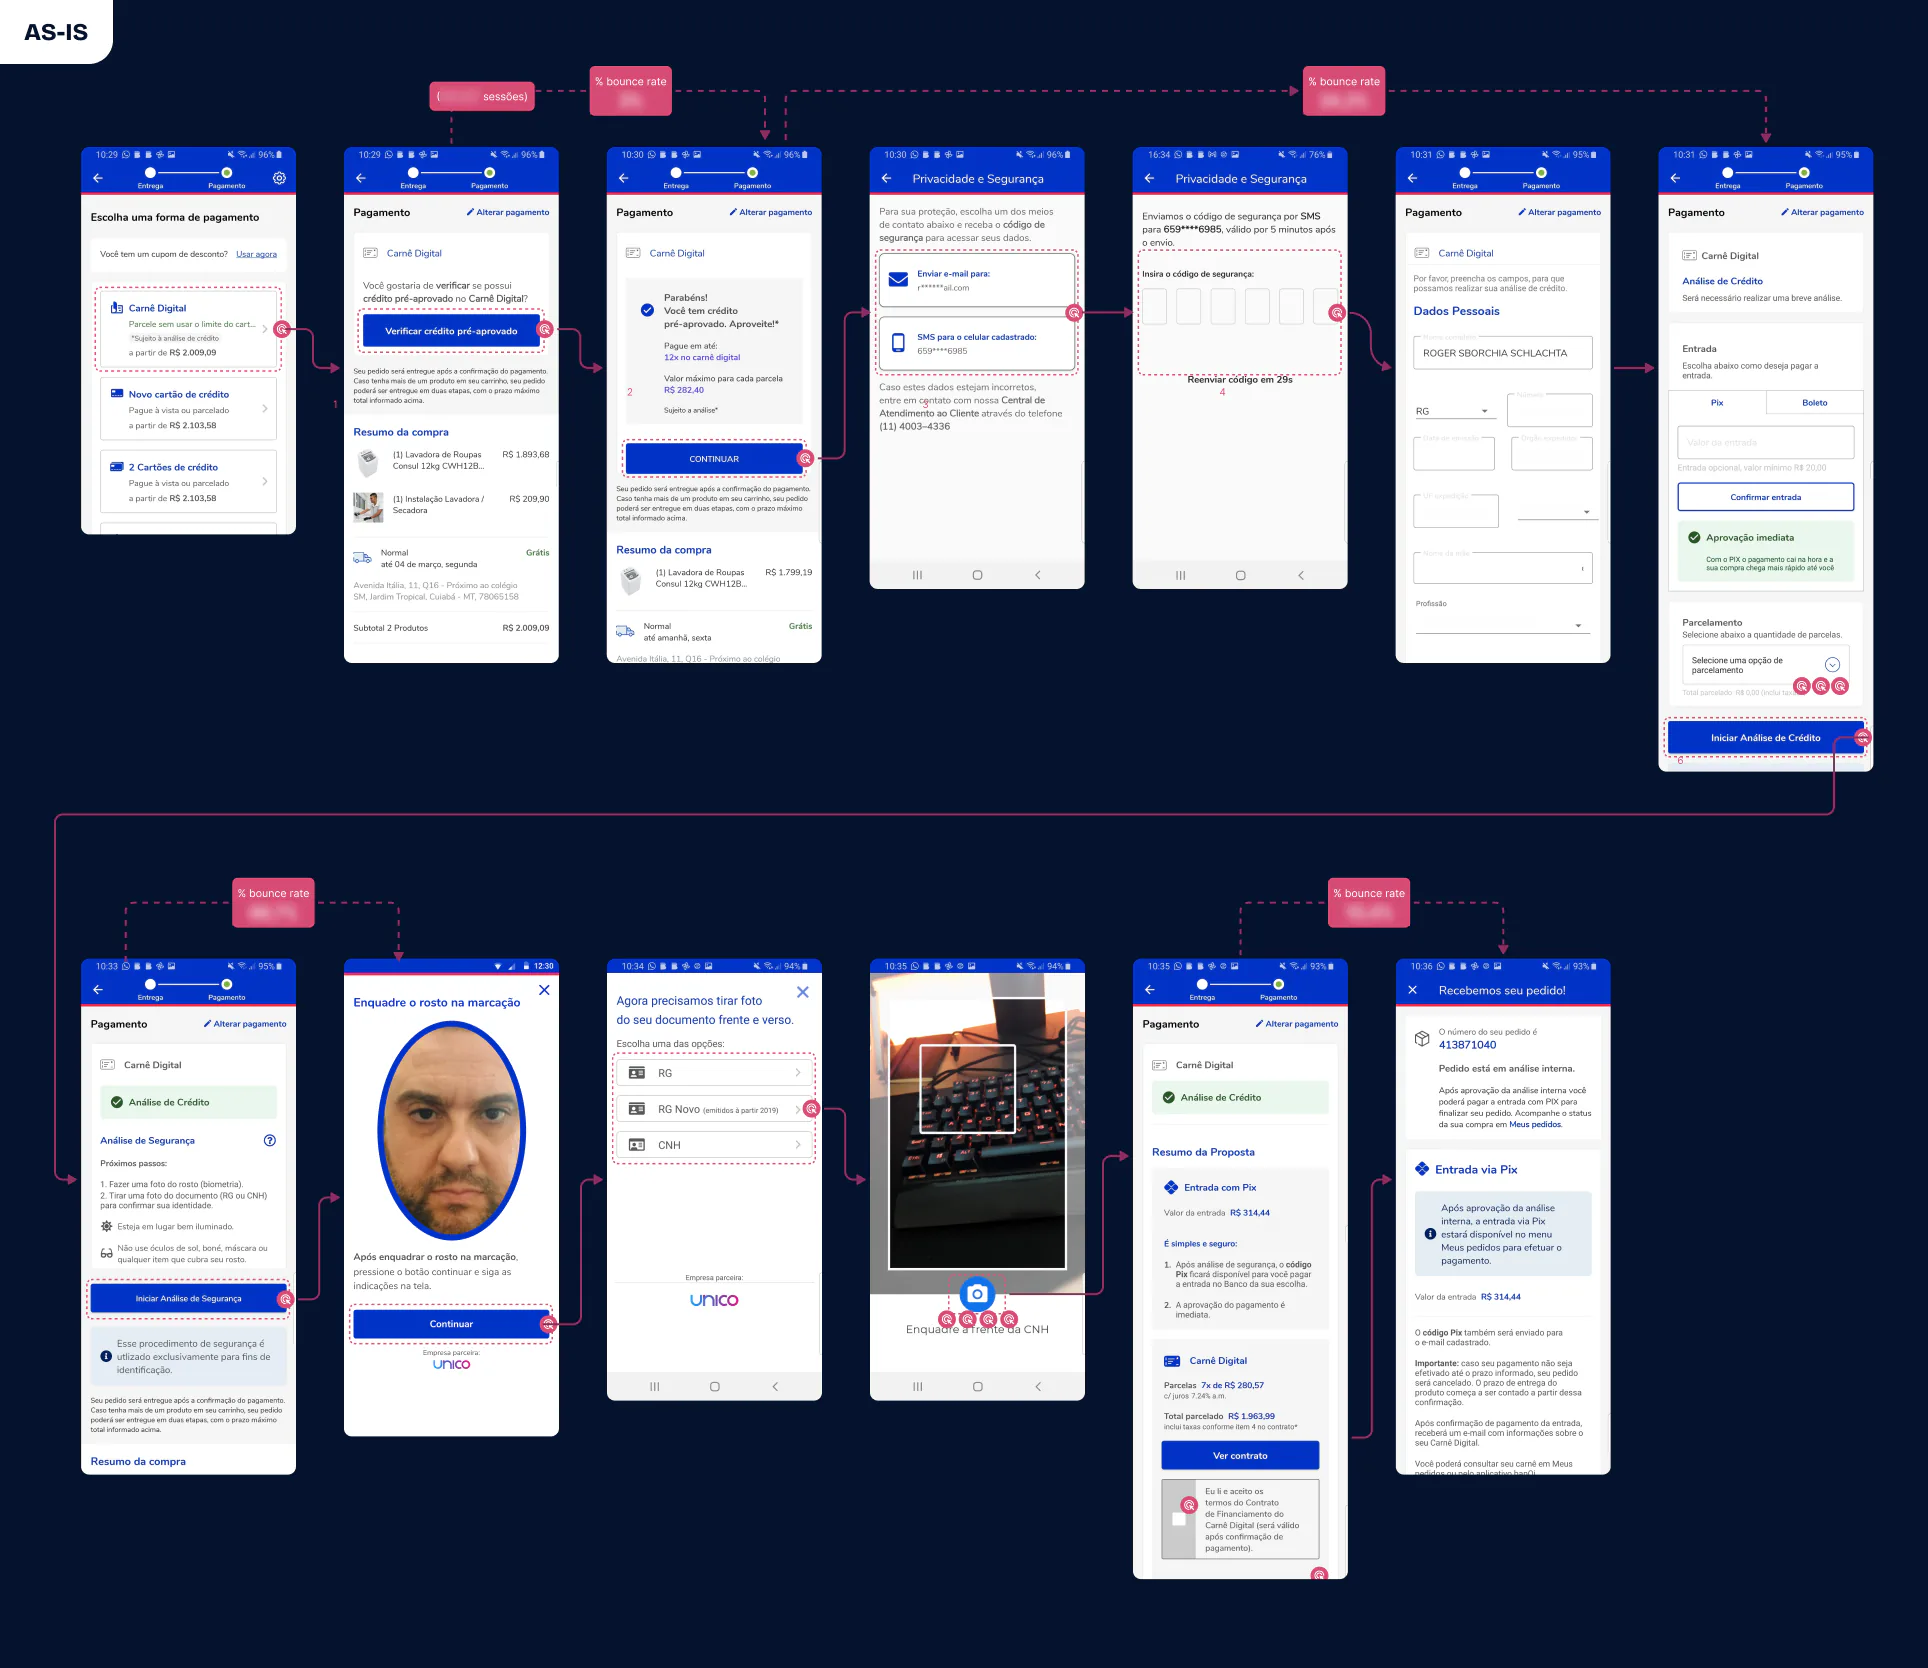
The data told us where. Research told us why. In the cancellation survey, which we ran again to compare with the previous year, 73% of those who dropped out only wanted a simulation, 160% more than before. In session recordings, 3 in 10 gave up at payment. And in the weekly interviews in a mirror room, 4 out of 5 people expected a Pix code on a screen that showed no code at all.
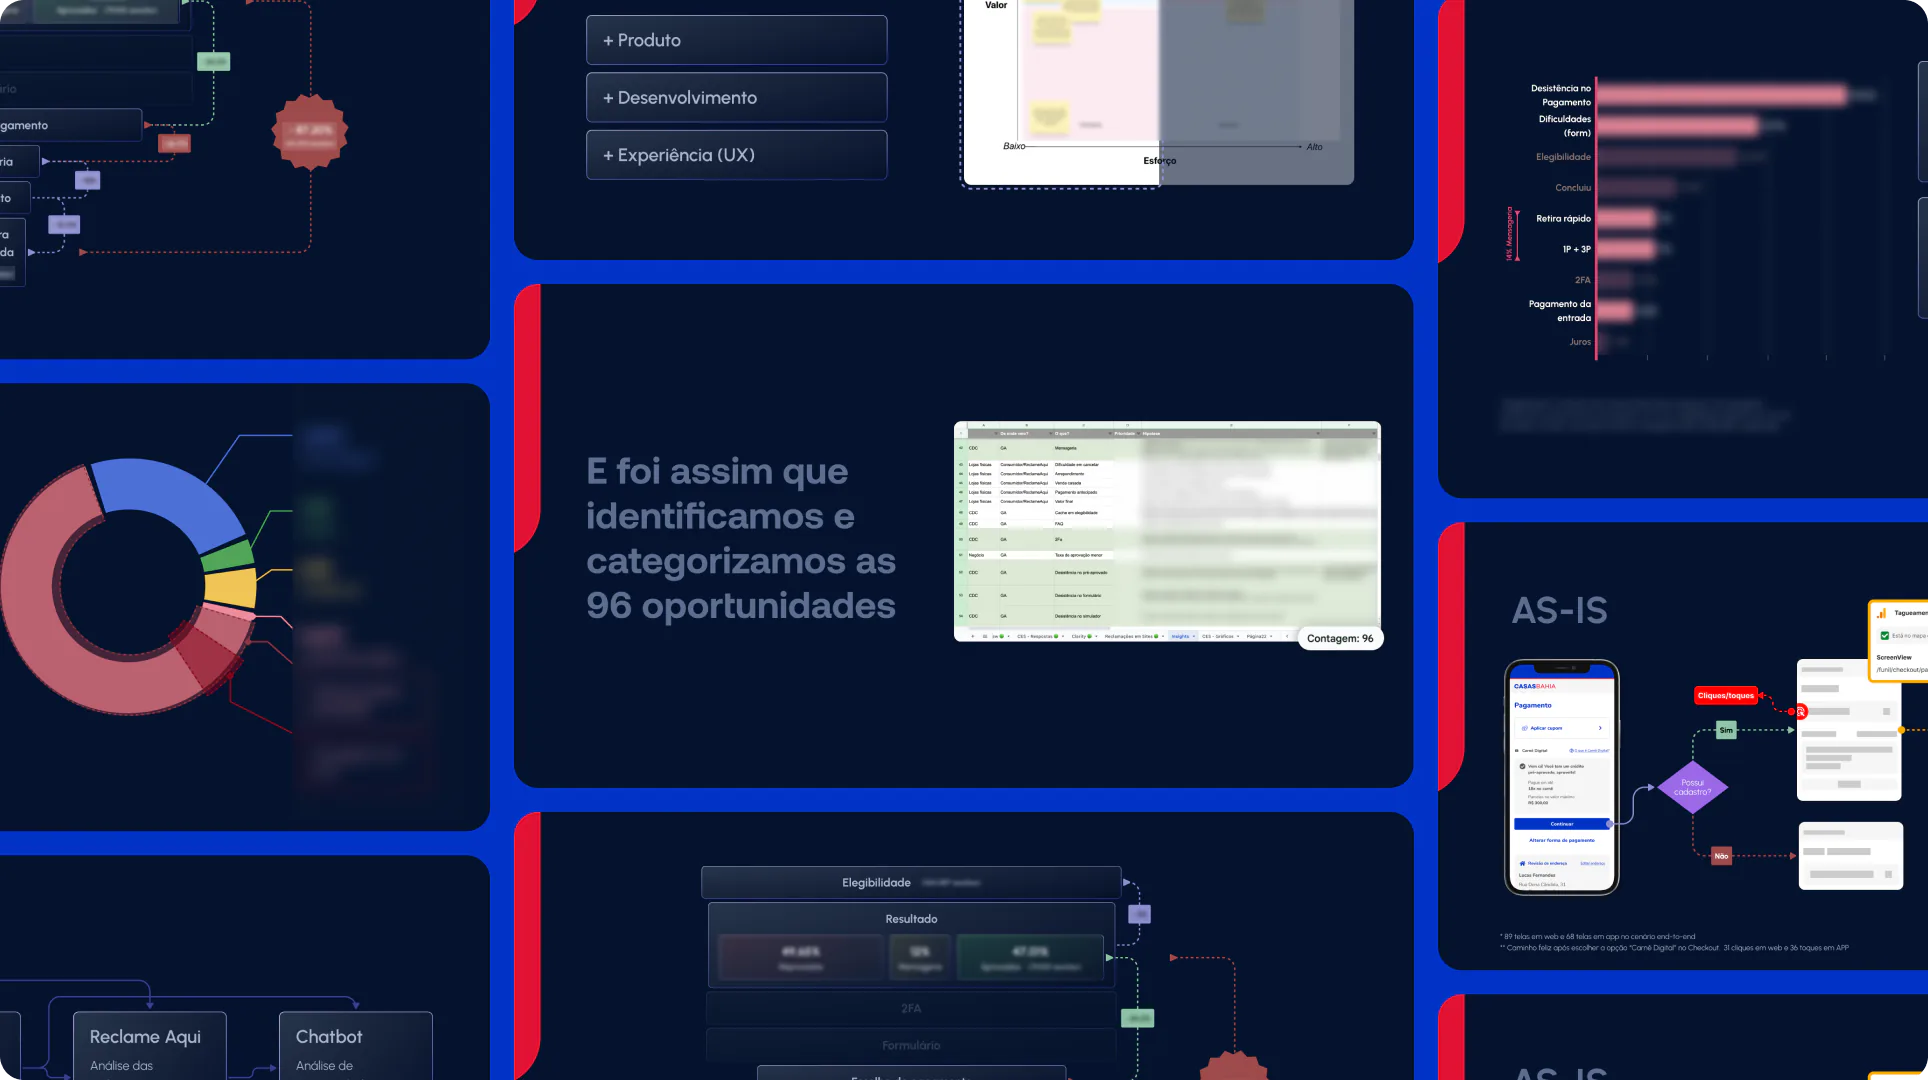
All of this became 96 opportunities. None got in on opinion: each went through the triad (is it worth it for users? what does it cost to build? what is it worth to the business?), and ideas from the business came in as hypotheses, researched like any other. That is how the business stopped sending requests and started deciding with us.
The first bet
Every customer who chose the Carnê went through a verification code and a huge form before knowing how much they could finance. We flipped the order: simulation comes first, the form only shows up for incomplete profiles and the code is kept for sensitive data. It shipped as an A/B test against the old journey.
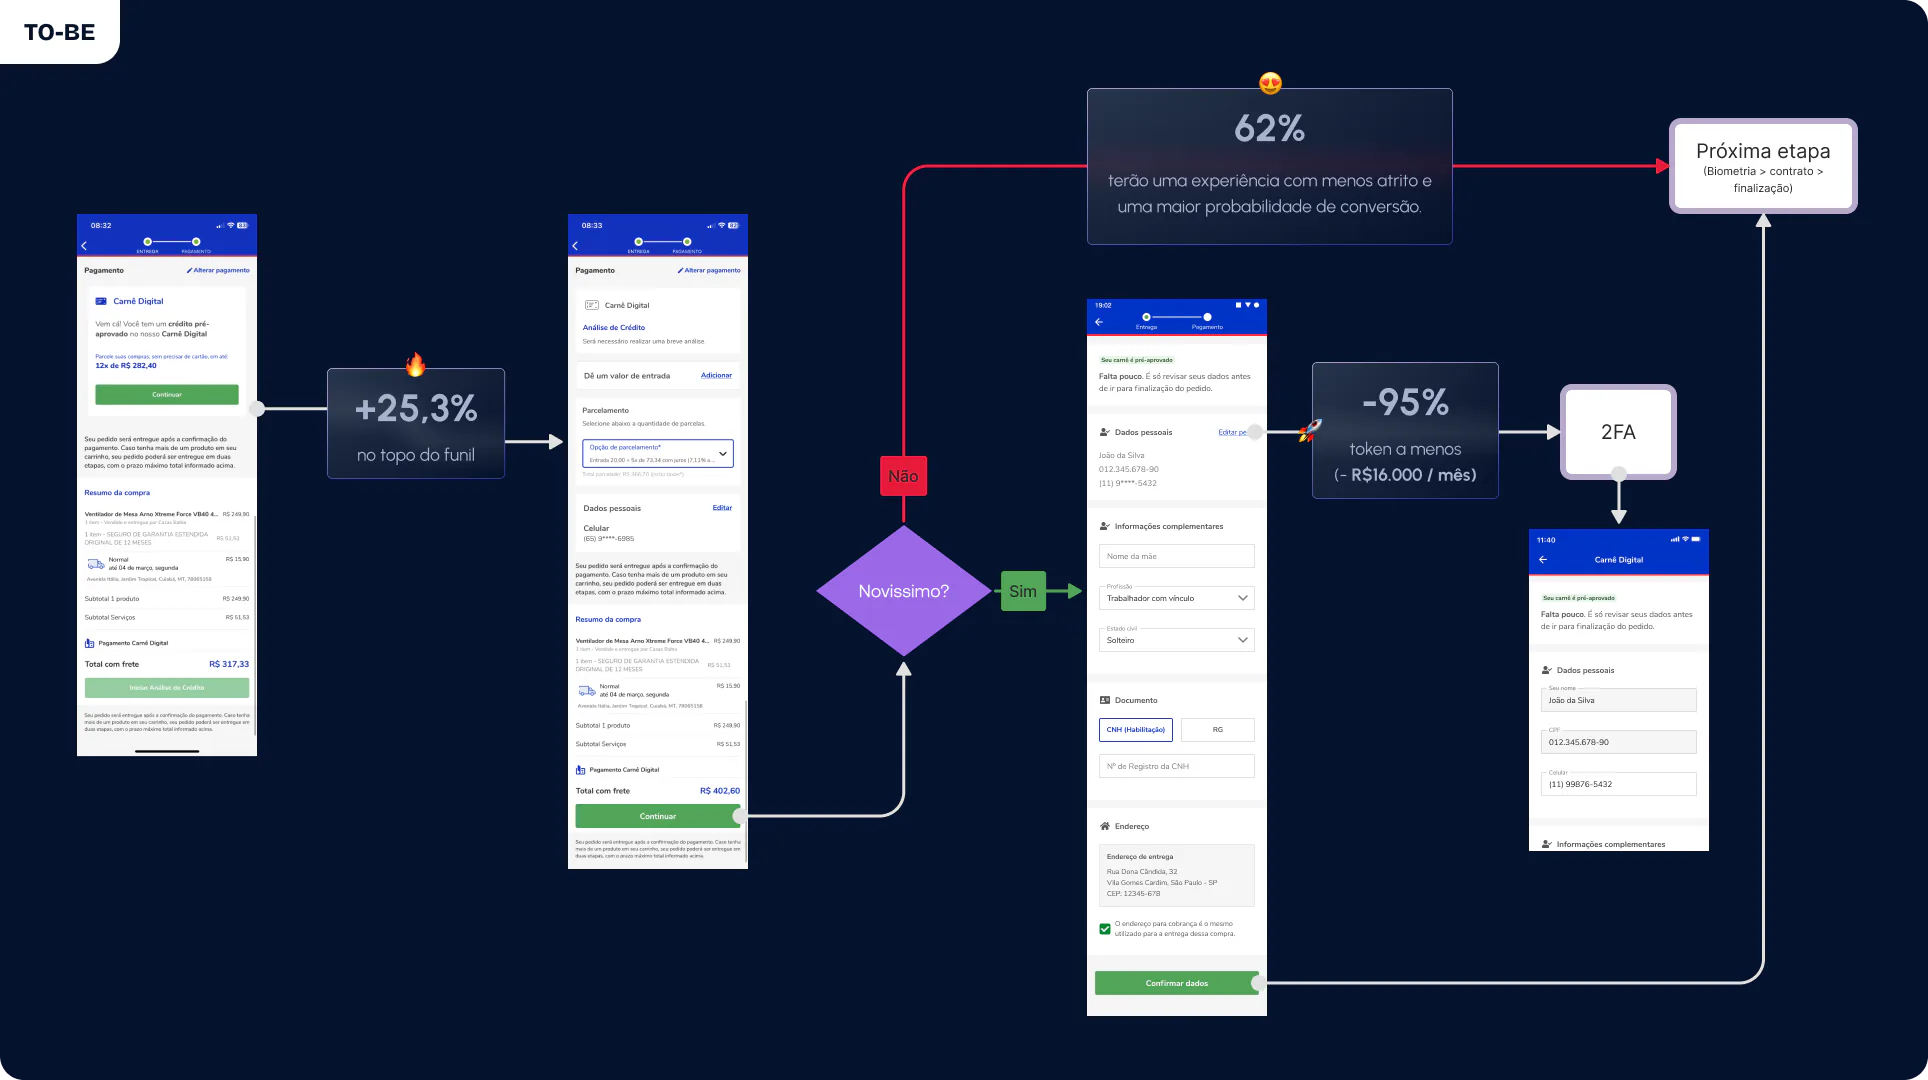
- +25.3% at the top of the funnel
- −95% of customers going through the verification code
Sending fewer codes was also a meaningful saving for keeping the product running. And signing up no longer depended on delivery outages or outdated phone numbers on file: whoever did not need the code was no longer stuck on it.
One screen at a time
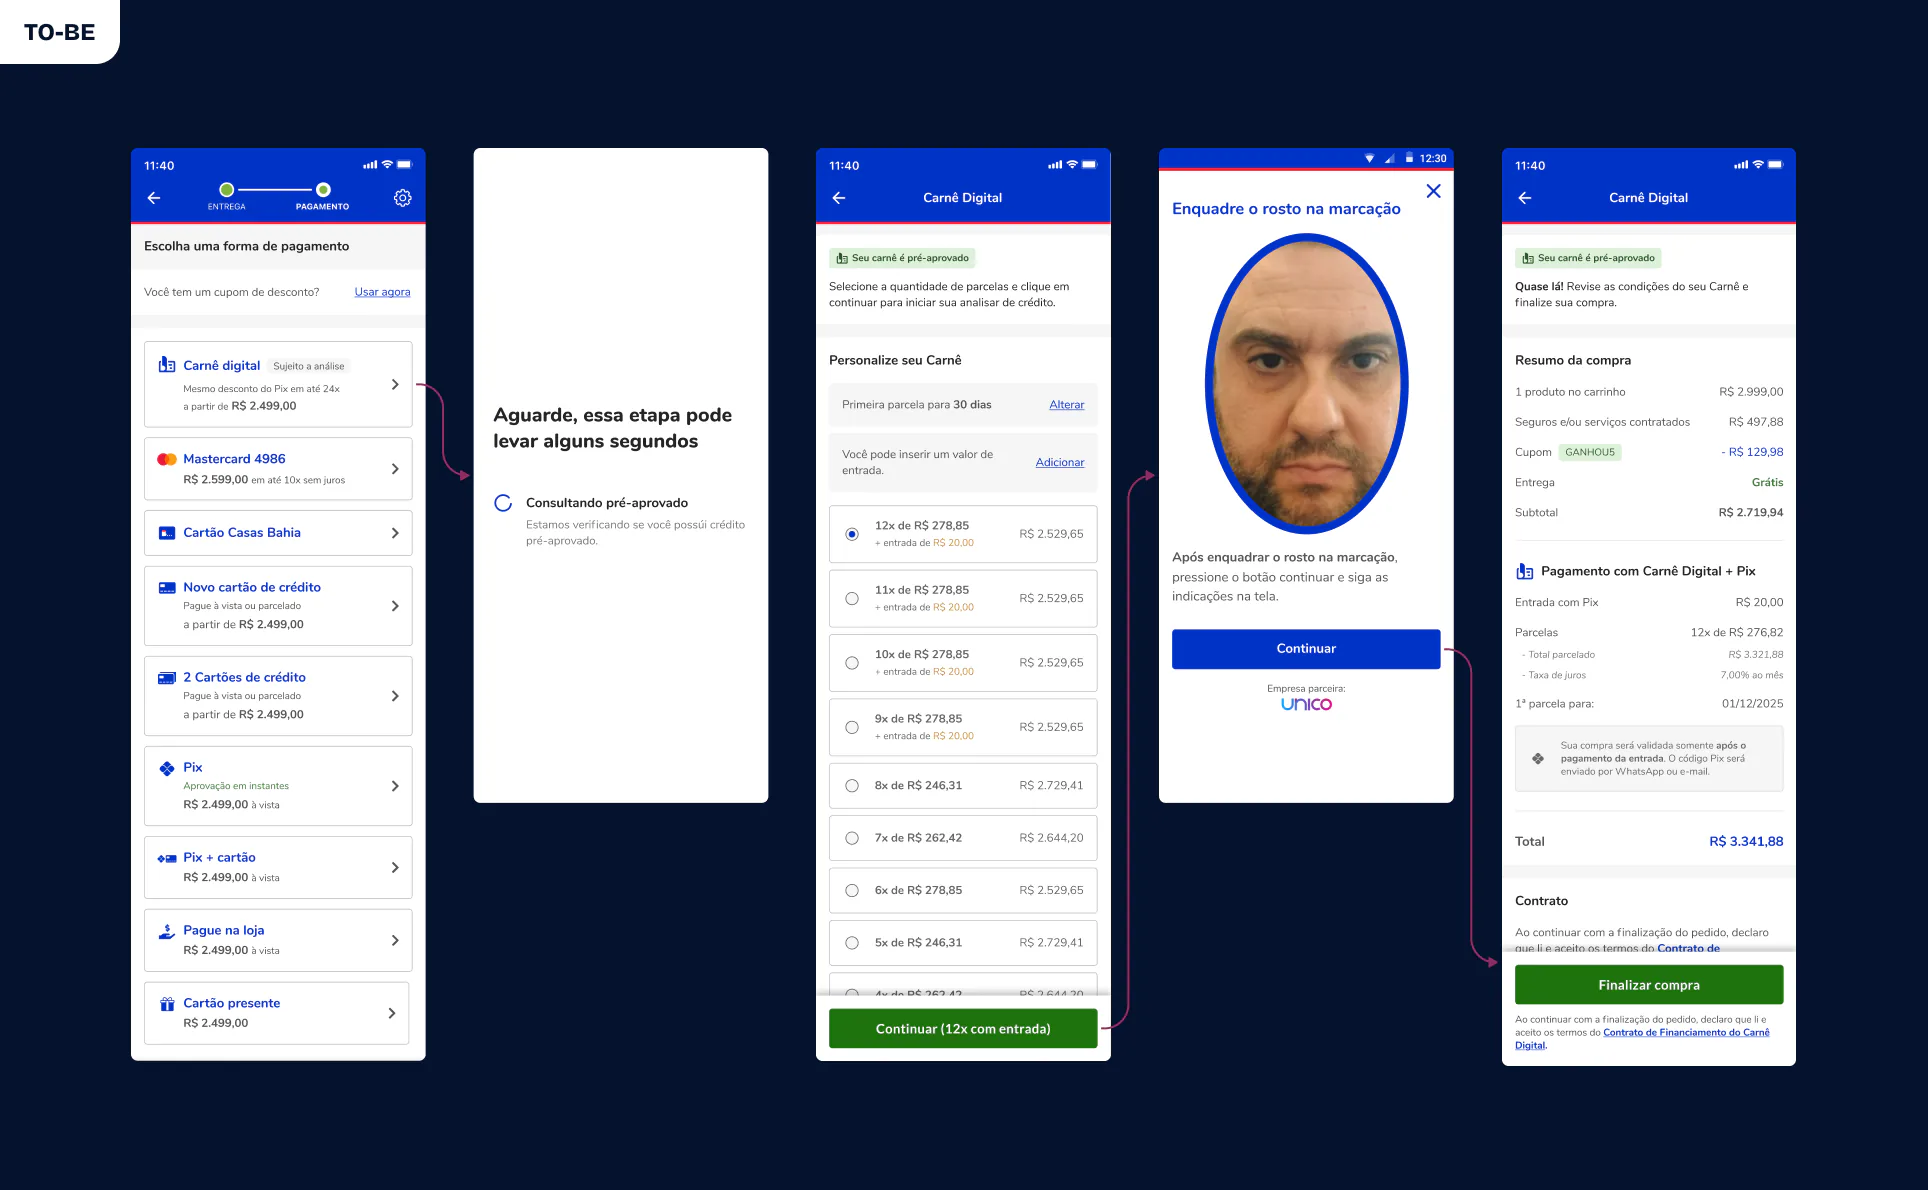
From then on, every friction became a test. The permission screens became a loading state. Payment started asking for one decision at a time. The form moved after payment. Biometrics went from four screens to a single photo. The summary became a receipt, and the final screen started showing the pending Pix. The A/B tests did not only look at conversion: they checked whether people could complete the task.
[Roger] played a leading role in building and defending a very ambitious proposal […]. Besides backing the hypothesis with data, he was essential in aligning the business areas and in winning sponsorship for the initiative.
Growth: bringing more people into the funnel
Simplifying the journey helped people who had already chosen the Carnê. We still needed more people to choose it. The Carnê banner on the product page only explained how to use it, and led nowhere. We started sending it straight to the express checkout and put the copy in an A/B test: the control, "Use it now", against "How to use it", "I want to use it", "Apply" and "Pay in installments now". A fifth variant, "Learn more", was cancelled during the test.
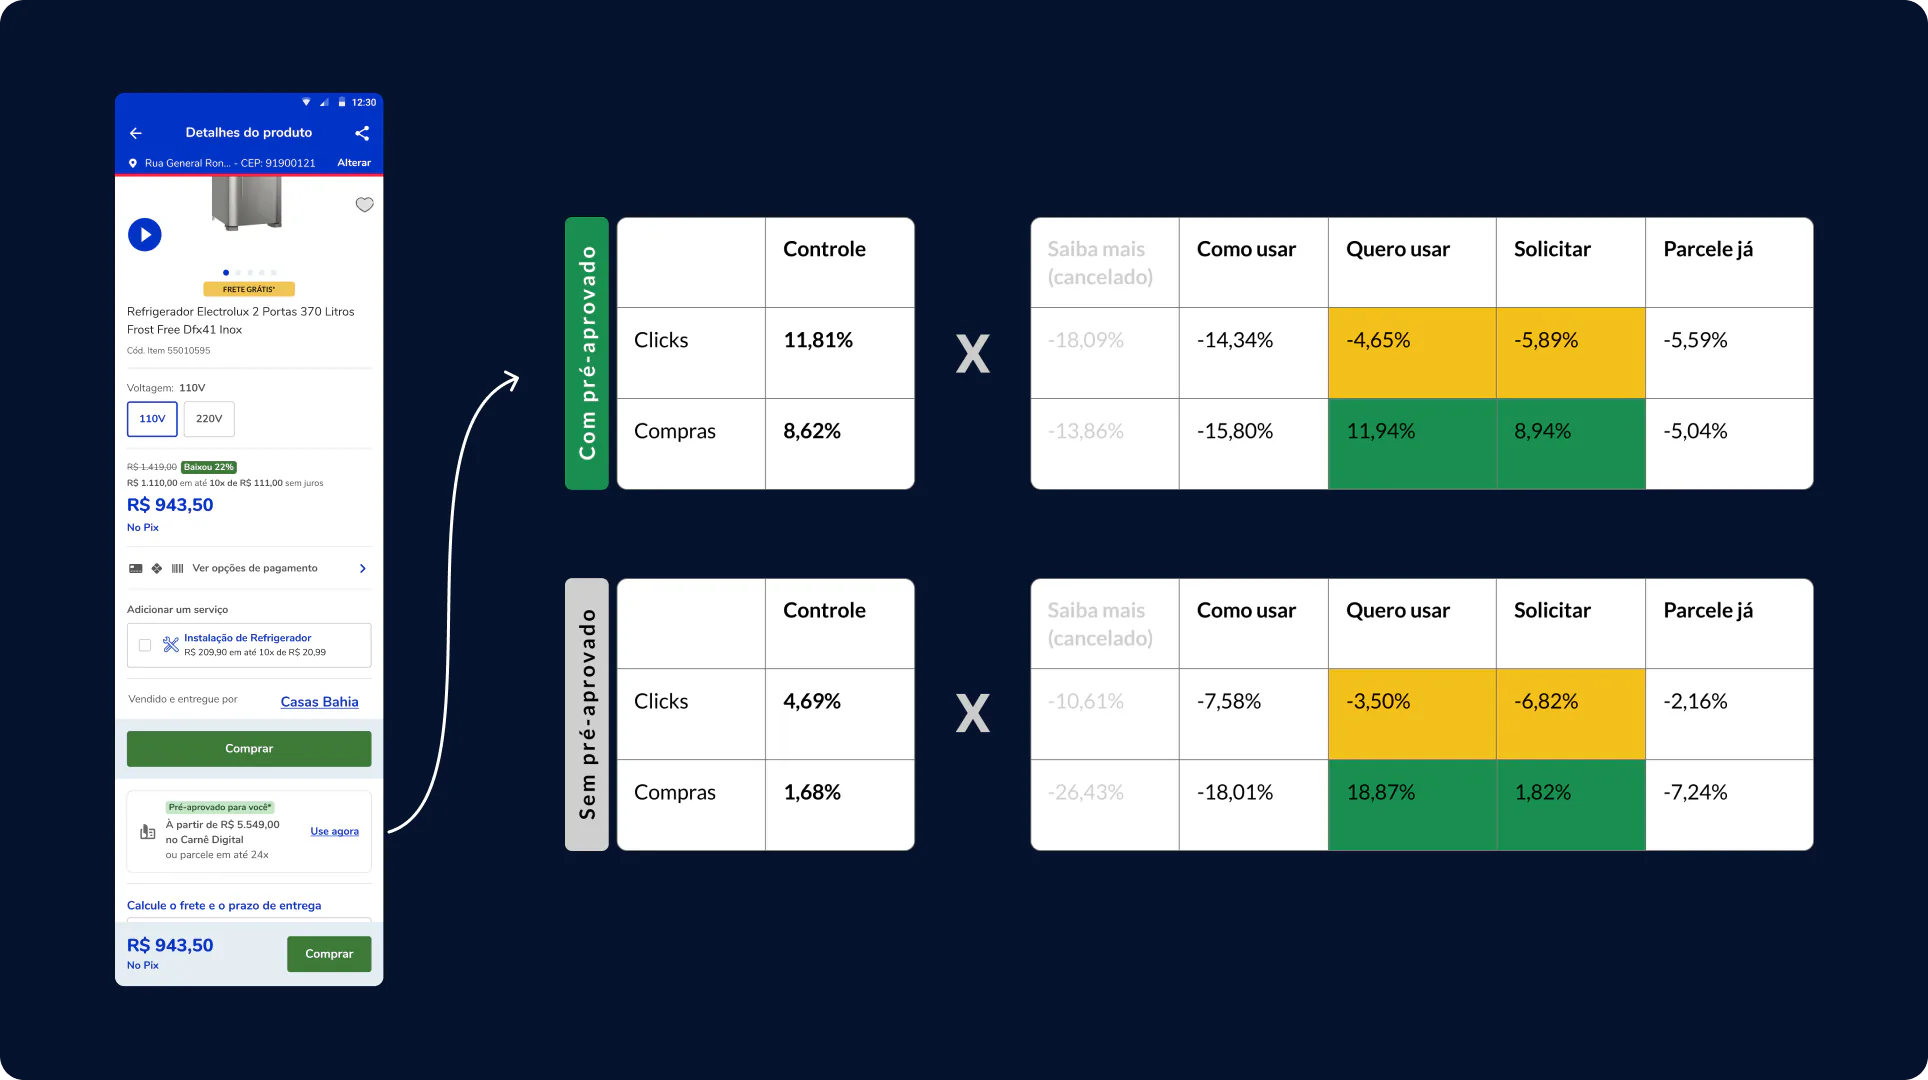
"I want to use it" won in a counterintuitive way: it got fewer clicks than the control (−4.65% among customers with pre-approved credit and −3.50% among those without) and more purchases. Clicks were not the right metric. That is why every test had its decision metric agreed before going live, and the rule was a completed purchase.
- +11.94% purchases with "I want to use it", among customers with pre-approved credit
- +18.87% purchases with "I want to use it", among customers without pre-approved credit
What went wrong
Carts with products from different sellers blocked the Carnê, and customers got a wall of text with no way out. We proposed moving forward with only the eligible items. The business blocked it: a solution already in progress would remove that message. We shipped the middle ground, a clear message with a direct way out, and the promised solution never arrived.
I should have pushed back with more data, showing what it cost every month, or picked the study back up once it was clear the fix was not coming. Today, when a blocker depends on another team's promise, I set a date to revisit it.
The result
33 clicks → 4 clicks
The journey went from 33 to 4 clicks, and form errors from 14% to about 1%. But the proof was in the business. Without showing the share itself, which is sensitive, the change tells the story: the Carnê grew year after year on digital, while in physical stores, which did not go through this discovery and testing cycle, it fluctuated and fell.
Change in the Carnê share, year over year
- Digital: 2023 0%, 2024 +52.9%, 2025 +9.0%, 2026 +17.6%
- Physical stores: 2023 −9.1%, 2024 +12.2%, 2025 −3.1%, 2026 −13.6%
Change versus the previous year. The work started to show from 2024, when we moved from the top to the middle of the funnel.
- ≈2x the Carnê share on digital, 2023 to 2026
- +9.9% conversion on the new payment screen, in completed purchases: revenue for the company and products delivered to customers
In the press · Exame (in Portuguese): Unfazed by high interest rates, Casas Bahia wants to expand digital store credit
Afterwards
With everything tagged and tested, every delivery came with proof, and design stopped defending opinions to show results. The discovery became the team's shared reference and has fed the roadmap for over two years. It is where the Portal do Carnê came from, which won first place at a hackathon and brought digital after-sales to the team.
Recognition
- The 4 clicks became an internal case: Stakeholders from other areas started asking the team for initiatives like it
- The 96 opportunities became a research case: Knowledge-sharing sessions to encourage other designers to do the same
We started out taking requests. We ended up setting the roadmap.
Source: GA4, CDC credit dashboard and A/B tests · 2022–2026
Tags: Product design, Digital credit, Store credit, Checkout, Discovery, User research, Data analysis, GA4, A/B testing, Growth, Conversion, Retail, Fintech